Services
 Aria: Live and Fixed cell sorting
- Data analysis of 1-15 colors
- 2 or 4-way sorting in tubes
- Sorting into culture plates or chamber slides
- Limiting dilution assays
- Clonal Expansion
- INDEX Sorts
- Purity check for all subpoplations
- Dependant on cell numbers, frequency and recovery
 Quick analysis of all data for ready reference, provided as ‘pdf’ file
- Overlaid histograms available on request
MACSQuant:
- Data analysis of 1-8 colors
- Self-operated
Consultation for experimental design with experience in:
- Multi-color panel design
- Multi-color staining and analysis
- Cytotxicity
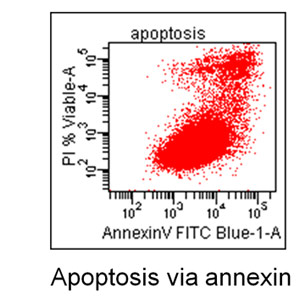
- Apoptosis via
- Tunel assay
- Caspase function
- Phosphatidyl serine via AnnexinV staining
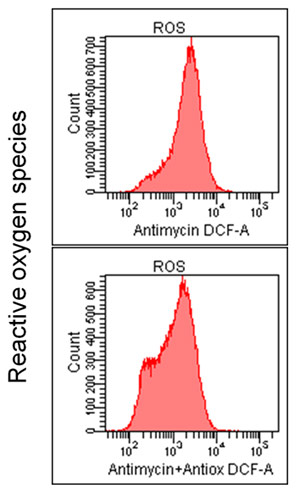
- Reactive Oxygen Species
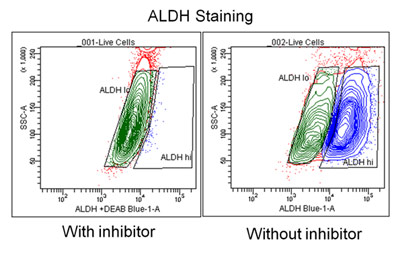
- ALDH Staining
- Cell Cycle and Proliferation
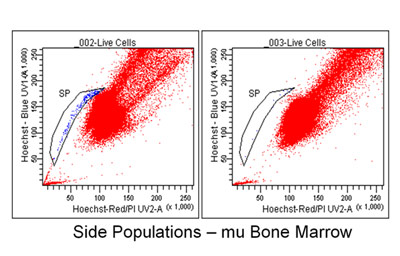
- Side populations via Hoechst staining
- Ratiometric Dyes
- Free analysis station with TreeStar FlowJo software available for individual users
 |
 |

